

WHERE WE ARE
March 1st seems like ages ago: on that date, the United States reported a nationwide total of just 62 cases of COVID-19; a nursing-home resident in Kirkland, Washington died of the coronavirus, only the second known American to succumb to the disease; and New York Mets baseball pitcher Jacob deGrom looked razor sharp in throwing three innings of shutout baseball in a spring training game versus the Washington Nationals.
In what seems like several months compressed into the space of six weeks, financial asset prices, volatility levels, market liquidity, and investor sentiment have been repeatedly and forcefully buffeted by:
i. Sharp increases in the global and U.S. coronavirus infection growth rates and mounting death totals from the pandemic;
ii. Enormous strains on the physical and human elements of the healthcare system as adequate supplies have been sought of protective gear; rapid, accurate testing protocols; and medical equipment, and crash programs have been launched in attempts to find curative medicines and crucially, therapeutic and preventive vaccines;
iii. The application of massive, rapidly-fashioned monetary policy programs and fiscal relief packages;
iv. Government-mandated lockdowns, cancellations, quarantines, travel restrictions, and social distancing measures leading to extremely sudden and highly synchronized economic slowdowns, business closures, supply chain disruptions, and contractions in world trade activity;
v. Heretofore unencountered increases in new filings for unemployment insurance benefits and estimates of future job losses;
vi. An oil price war, ostensibly between Saudi Arabia and Russia, with deleterious effects on global oil and gas prices; and
vii. A veritable torrent of web-based and media-delivered coverage, press conferences, medicinal advice, conspiracy theories, tragic patient and healthcare provider contagion sagas, geopolitical prognostications, Twitter feeds, Instagram posts, disease progression modeling, and economic forecasts, some quite dire, even apocalyptic, and others, not nearly so saturnine and dyspeptic.
THE BEAR CASE
In our opinion, the more-negative, bearish case is based on several worrisome factors:
i. Consumer, corporate, and investor confidence deteriorates as the unfavorable news flow continues about infections and death rates (among persistently elevated concerns about the likelihood of a recurrence in the autumn of 2020 and beyond), even as some areas show signs of leveling off and/or decline;
ii. Financial assistance does not arrive with sufficient targeting, timeliness, nor magnitude to resuscitate or prevent the demise of a significant portion of small- and medium-sized businesses, which account for 44% of U.S. GDP and 47% of private sector employment;
iii. U.S. GDP and corporate profits exhibit very poor (currently, almost unforecastable) results in 2020, with an uncertain, feeble recovery outlook for 2021;
iv. Given high pre-crisis indebtedness, a greater-and-more-widespread than expected level of downgrades, defaults, bankruptcies occurs in the corporate sector, and perhaps also transpiring in the municipal realm;
v. Crude oil and natural gas prices remain under significant pressure for far longer than anticipated, exacting a significant financial and employment toll on highly leveraged entities in the energy industry; and
vi. Societal cohesion and confidence in the wisdom and efficacy of the authorities’ actions suffers some meaningful degree of permanent erosion, with harmful effects on identity, shared values, trust, cohesion, reciprocity, and productivity.
THE BULL CASE
In our opinion, the more-positive, bullish case is based on several constructive factors:
i. Through antibodies testing, isolation, social separation, quarantines, warmer weather, medical treatments, and eventually, vaccines, COVID-19 is brought under control;
ii. Very little damage to the internet, communications, marketing relationships, and transportation infrastructure, combined with “postwar-like” unleashed pent-up demand augmented by newly-restored, improved supply chains are force-multiplied by U.S. Government stabilization programs aimed at individuals and businesses, by sizable infrastructure spending legislation, and by Federal Reserve actions (featuring continued low interest rates, financial support facilities, currency swap lines with foreign central banks, and Quantitative Easing (“money printing”), producing a surprisingly strong restorative effect on psychology and commerce;
iii. Corporate defaults end up being limited to weaker credits and kept at or below predicted rates;
iv. Oil and gas prices return to economically justifiable levels, as meaningful output reductions are agreed upon between the OPEC+ countries (including Russia) and U.S. producers; and
v. A newfound sense of survival gratitude, lifestyle and life-rethinking, national purpose, goal-setting, prioritization (to better prepare for future such challenges), some marginally-improved bipartisan cohesiveness, innovative technological, business, and educational energy, and affirmative direction takes the American nation to new high ground and a luminous era of advancement and restoration.
PORTFOLIO POSTIONING
As of now, quite a bit of bad news has already been reflected into asset prices, and our counsel for the past several months of caution and conservatism has for the most part proved a reasonably defensible and defensive strategy.
While it is quite possible that equity prices and interest rates will retest or even go below their recent lows, we give this scenario a slightly greater than even chance, as the negative fundamental news flow on the pandemic, the economy, and corporate profits seeps into and leads to further investment de-risking, we are inclined to put a modest portion of available cash reserves, if applicable, into high-quality assets (equities, perhaps some gold, and sterling-quality investment grade fixed income securities) of companies possessing fortress-like, cash-rich balance sheets, dividend strength, and defensible business models able to generate high returns on equity over a long time frame. Investors should also consider alternative investments in private credit, private real estate, and opportunistic strategies that are positioned to extract significant value during the current dislocation.
THE UNEMPLOYMENT OUTLOOK
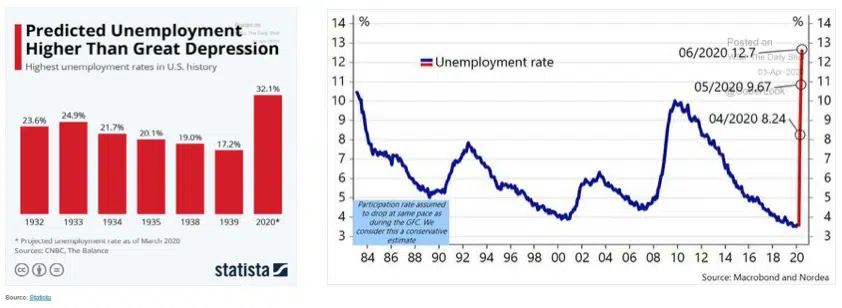
From its March 2020 reading of 4.4%, the U.S. unemployment rate has been recently projected by Macrobond and Nordea to rise to 8.24% in April, 9.67% in May, and 12.7% in June, with CNBC, Bloomberg, and Refinitiv reporting that some sources are forecasting the U.S. unemployment rate could possibly top out around 30%. This is consistent with the more than 22 million jobless claims filings for the four weeks ending April 11th, which means that more than 14% of the 151 million-person U.S. labor force were out of work. In late March, St. Louis Federal Reserve Bank President James Bullard predicted the U.S. unemployment rate may hit 30% in the second quarter because of shutdowns to combat the coronavirus, with an unprecedented 50% drop in gross domestic product. Given the uncertainty of the times, forecasts can vary significantly as we can see. If such a jobless rate should occur, the Statista chart above shows that 30% or more unemployment would surpass the maximum unemployment percentage in each of the six worst unemployment years of the 1930s Great Depression. In our opinion, such severe readings are unlikely to come to pass, and if they did, it would be most likely for only a brief period of time because:
i. the economy should begin recovering as people return to work with more widespread testing leading to the plateauing of the coronavirus; and
ii. the lagged stimulative effects should kick in from the monetary and fiscal support implemented shortly after the severity of the pandemic began to be more broadly recognized.
At the present moment, we assign a less than 25% chance of this severe scenario unfolding, and if it did look likely to persist for any significant length of time, allocation positioning should be devoted to high quality assets.
PREDICATIONS OF ECONOMIC CONTRACTION
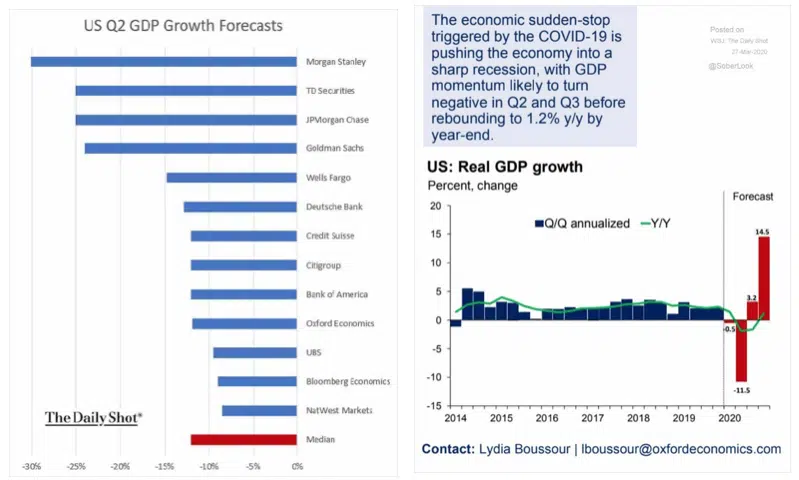
The above economic forecasts (in the left panel) for 2Q2020 U.S. GDP exhibit a wide range of annualized rates of decline, from -30% by Morgan Stanley to -9% for NatWest Markets, with the median forecast at -12.5%, which is closer to our own thinking. The differences in the above forecasts primarily stem from varying assumptions as to:
i. the efficacy and reach of the fiscal and monetary assistance programs;
ii. the severity and persistence of short-and intermediate-term impacts of the pandemic (and measures taken to counteract it) on business outlays, employment, consumer confidence, and personal spending and savings rates; and
ii. how fast and to what degree conditions return to the neighborhood of pre-crisis levels.
In the second panel, Oxford Economics projects a -11.5% annualized year-over-year rate of decline in U.S. GDP in 2Q20, followed by +3.2% annualized in 3Q20, and then +14.5% annualized in 4Q20. Should something similar to this forecast pattern unfold, equity prices and interest rates should rise, with outperformance by consumer, transportation, energy, industrial, materials, and financial stocks. Utility issues should lag, with pharmaceutical and other healthcare stocks once again likely to find themselves influenced by the tone and rhetoric of the national elections on Tuesday, November 3, 2020.
It should be kept in mind that the 2020 pandemic recession follows eleven years of economic growth, the longest recorded economic expansion in U.S. history. The 2009-2020 recovery featured:
i. materially increased corporate and government indebtedness and;
ii. more modest rates of GDP growth, the latter of which perhaps helped avoid some of the economic overheating and inflationary forces associated with more robust expansions.
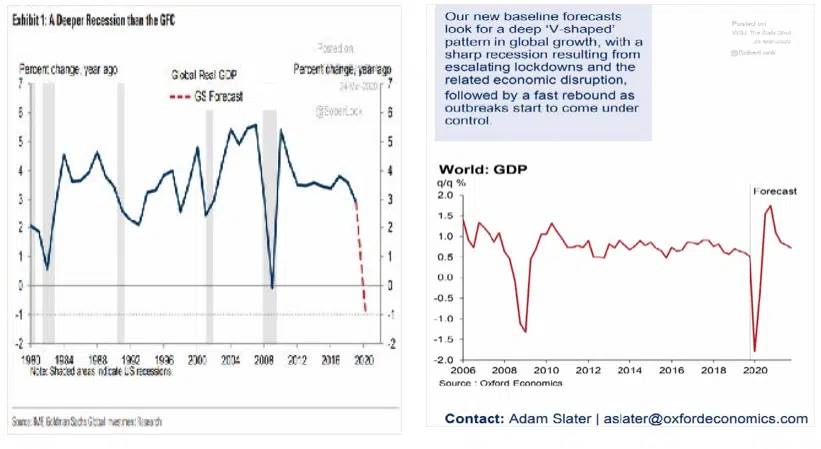
Even as this recession is likely to be deeper than the recession experienced in the 2008-2009 Global Financial Crisis (as projected in the top left panel), the government-mandated nature of the lockdowns and cancellations underpins our current belief in a moderate recovery, which should become somewhat more vigorous with the passage of time, without persistently higher levels of precautionary savings post-crisis eating into personal consumption and thus miring the U.S. economy in ongoing economic stagnation. Our call to selectively add exposure to risk assets is predicated on the assumption of a modest-at-first 3Q20 U.S. recovery that gradually adds momentum in 4Q20 and into 2021.
In the right panel above, Oxford Economics is projecting a swift and sharp V-shaped rebound in the global economy, paced by the U.S. and particularly, by China. By contrast, owing to many countries’ generally less-aggressive policy measures taken to counteract the economic impact of the coronavirus, we have currently adopted more of a “wait and see” stance on the economic growth outlook (and thus the debt and equity securities) of developed economies (including Europe, Japan, Canada, Australia, and others) as well as the emerging economies (of Asia, Latin America, Africa, the Middle East, and elsewhere).
THE PROFITS OUTLOOK
According to consensus forecast data compiled as of April 6, 2020 by Yardeni Research, Inc., the historical and estimated earnings per share and year-over-year growth rates for the Standard & Poor’s 500 companies are as follows :
i. For 2017, $131.98, +11.8%;
ii. For 2018, $161.93, +22.7%;
iii. For 2019, $160.00, -1.1%; and
iv. Estimated for 2020, $120.00, -26.4% (with quarterly year-over-year comparisons of 1Q20 -23.4%, 2Q20 -51.6%, 3Q20 -28.8%, and 4Q20 -4.8%); and
v. Estimated for 2021, $150.00, +25.0% (it should be pointed out that these S&P 500 earnings per share, if achieved, would still be roughly 7% below the 2018 and 2019 results).
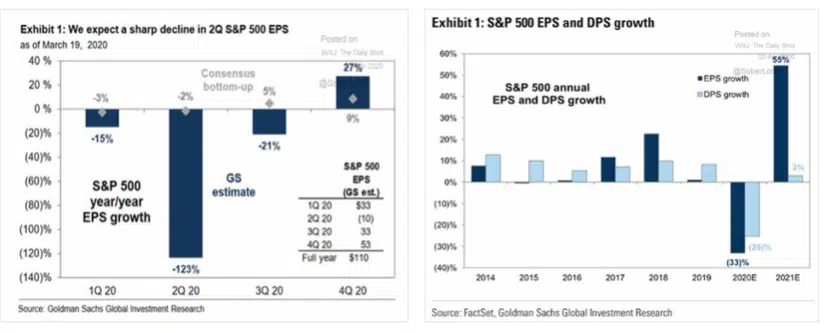
In each of the two panels above, it can be seen that Goldman Sachs expects a deeper year-over-year earnings decline than does Yardeni Research for the full year 2020 (-32.5%) and in 2Q20 (-123%), with a higher-than-consensus year-over-year recovery in 4Q20 (+27%) and for 2021 (+55%).
Recognizing that forecasting earnings is particularly difficult in the current uncertain environment for interest rates, domestic and international economic growth, currency levels, energy prices, wage rates and hours worked, our view currently stands closer to the consensus view, with S&P 500 earnings per share likely to decline more than 25% this year and then rebound by a similar 25% in 2021. This supports our call for continued emphasis on defensive sectors and highest-quality assets, with a disciplined, measured, dollar-cost-averaging approach to adding risk through each phase of the public health and economic crunch.
The second panel above also shows that total S&P 500 dividends are estimated as likely to fall by 25% in 2020, followed by a minuscule +3% expected dividend growth in 2021. This underscores our longtime emphasis on companies with high returns on equity, adequate current and future after-tax earnings, sufficient liquidity and cash levels, and manageable leverage that can maintain or even increase their dividend payouts through capital discipline, balance sheet strength, and financial prudence.
BEAR MARKET EPISODES
The suddenness and severity of the recent equity market selloff stimulates questions as to: how long the U.S. equity bear market might continue; whether or not the maximum decline has been experienced; and how long it will take for the S&P 500 index to again reach its February 19, 2020 record closing high of 3,386.15.
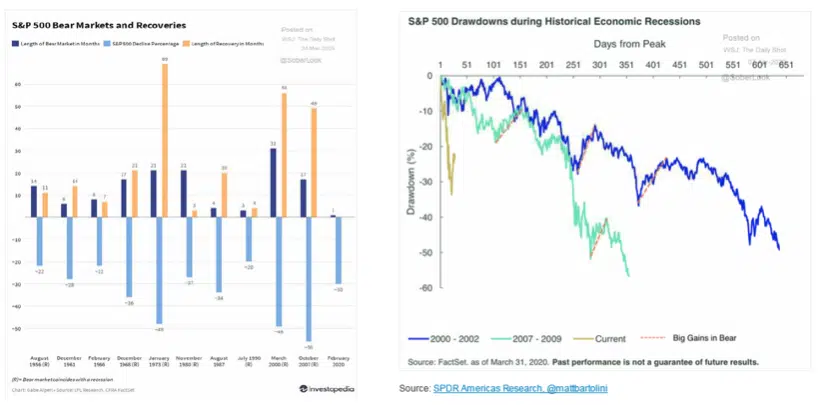
With full awareness that “although history never repeats itself, it sometimes rhymes,” the upper left panel may provide some perspective. For the 10 S&P 500 bear market episodes (excluding the current one) experienced from the mid-1950s to the present, the chart shows:
i. The duration of the bear market episodes ranged from a low of three months in 1990 to a high of 31 months in the 2000-2002 interval, with an average (mean) duration of 14.2 months, or just over a year;
ii. The severity of the bear market declines ranged from a low of -20% in 1990 to a high of -56% during the 2007- 2009 years, with an average (mean) decline of -34.2%; and
iii. The length of the recovery to the previous highs ranged from 4 months in 1990 to 69 months during the tumultuous decade of the 1970s, with an average (mean) recovery taking 25.4 months, slightly over two years.
The severity and length of this decline, as well as the path and length of the stock market recovery, depend on numerous factors, including:
i. How successful the authorities in the United States (and not to be minimized, internationally) can bring the spread of the pandemic under control and develop preventative and therapeutic vaccines and other medicines;
ii. How quickly the lockdown orders and other containment measures can be lifted, allowing academic, business, travel, entertainment, and other activities to resume;
iii. How profoundly the psychological impact of this crisis affects corporate and consumer behavior, savings rates, and investment; and
iv. The initial stages of enduring longer-term consequences for commerce, societal norms, supply chain structures, global trade patterns, energy markets, political dynamics, and geopolitical relationships.
Notwithstanding the drawn-out experiences of the 2000-2002 dotcom bust bear market and the 2007-2009 mortgage finance bear market, delineated above in the upper right panel, our current assessment, given how swiftly the S&P 500 index “took its bitter medicine early,” is for U.S. equity prices this time to experience a briefer-than-average bear market time span (under a year in length), an average S&P 500 bear market total decline (meaning a good part of the damage has already been done), with a below-average length of time needed to reach the February 2020 highs (perhaps comfortably before the rescheduled Tokyo Olympic Games, July 23-August 8, 2021).
THE OIL OUTLOOK
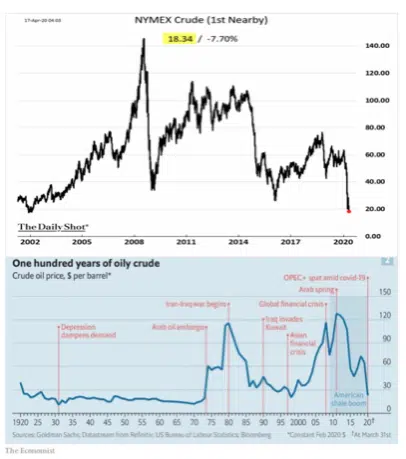
Over the weekend of April 11–12, 2020, OPEC and allied oil producers, led by Saudi Arabia and Russia, agreed to cut production by 9.7 million barrels per day (roughly one-tenth of global supply) during May and June, with Saudi Arabia and Russia together sharing 5.0 Million barrels per day of the cuts, and other OPEC+ producers agreeing to remove an additional 4.7 million barrels per day. With G20 support in the form of oil purchases for storage and declining production in North America, this could mean as much as 15 million barrels per day of supply will potentially be removed from the market. Combined with existing sanctions on Iran and Venezuela and outages in other countries such as Libya, the measures could help withhold as much as 20 million barrels a day of supplies from the market, OPEC stated in a draft press release.
The top panel shows NYMEX Oil Futures over the past 20 years, now in the high teens for West Texas Intermediate Crude. Covering a much longer time frame, the bottom panel illustrates the cyclicality of oil prices ever since the early 1970s, when the U.S. dollar was de-linked from gold and allowed to float freely subject to market forces. Given current projections of oil’s pandemic-stage global demand swiftly declining by as much as 30 million barrels per day or more, without further supply reductions, it will be virtually impossible to achieve oil prices anywhere near the $40-$50 per barrel range, which represent breakeven levels for many U.S., Canadian, and other producers, much less for national petroleum companies which need these or higher prices to help balance their governments’ annual spending budgets (The Wall Street Journal reports that Russia needs an oil price of $40 a barrel to balance its budget and the Saudis around $80). Several forecasters have even predicted single-digit prices as pipes, tank farms, oil at sea, and floating storage facilities reach capacity. Facing limited places to stockpile oil, crude has recently changed hands for as little as (and even below) $7.00 a barrel in Midland, Texas, and $5.00 a barrel in Alberta’s oil sands.
Such dramatic dislocations have numerous adverse and damaging implications, a few among them:
i. Even as stronger energy firms consider whether to acquire the assets of their weakened and/or bankrupt competitors, they face decisions whether to implement the drastic and potentially costly actions of shutting loss-making wells, risking downhole groundwater and corrosion damage to the associated reservoirs (Rystad Energy, a Norwegian independent energy research consultancy, has predicted that U.S. production could fall by close to 4 million barrels per day by the end of 2021, compared with a record high daily output above 13 million barrels in late February);
ii. Already in 2020, U.S. producers have responded to the collapse in demand (and a price war led by low-cost producing nations to gain market share) through 30-50% cutbacks in capital spending; oil service companies face equally or more severe business reductions as, according to Baker Hughes, the number of rigs drilling in the United States has fallen to 600 in mid-April from 800 in early March;
iii. With traditional buyers of high- yield debt having become more discriminating, many heavily indebted shale energy companies are now struggling to make interest payments on the debt they carry and are finding it challenging to raise new financing. According to Moody’s, North American oil exploration and production companies have $86 billion in debt maturing between 2020 and 2024, and pipeline companies have an additional $123 billion in debt coming due over the same period; in 10 of the last 11 years, energy companies have been the single largest junk bond issuers, and since 2016, when oil prices began to decline, more than 208 North American producers have filed for bankruptcy involving $121.7 billion in aggregate debt;
iv. In efforts aimed at protecting their dividends amidst flat to down oil production and depressed prices, the larger, well capitalized oil companies have increased borrowing, cut capital expenditures, suspended stock repurchase programs, and implemented workforce reductions; and
v. Slumping oil prices and production levels have put meaningful downward pressure on tax revenues, government budgets, employment levels, and the economies of several oil-producing states including Texas, Oklahoma, North Dakota, and Alaska, especially in rural areas heavily dependent on oil.
Over the intermediate-term into 2021, it is possible to foresee a structural shift towards higher oil prices as economies recover, demand begins to normalize, and new investment in oil supply becomes required. For patient, contrary-minded investors, we continue to strictly emphasize quality in purchasing the equity and debt issues of companies in the energy space, focusing on enterprises with:
i. diversification in upstream, midstream, and downstream operations;
ii. discipline in capital allocation; and
iii. dividend protection.
THE FEDERAL RESERVE AND DEFICIT FINANCING
Beginning by cutting interest rates effectively to zero and announcing a $700 billion round of quantitative easing (“money printing”) on Sunday, March 15 in a surprise press briefing, the Federal Reserve embarked on a large-scale program employing a broadening array of policy actions, emergency powers, and lending programs in order to stabilize the U.S. economy under pressure from the COVID-19 pandemic. Among other additional steps taken in succeeding weeks, these measures include:
i. Loosening banks’ balance sheet reporting requirements, total loss absorbing capacity metrics, required capital levels, non-critical oversight reviews, reporting schedules, counterparty risk assessment methodologies, U.S. Treasury securities-for-repurchase agreement exchange protocols, and corporate ownership control provisions;
ii. Encouraging more active use of the Fed’s “discount window” (which banks can use as an emergency funding source);
iii. Coordinating international actions with an expanded roster of foreign central banks to improve access to U.S. dollar liquidity swap arrangements; and iv. Creating funding facilities and/or giving regulatory relief to support taxable and tax exempt commercial paper, collateralized loans to large broker-dealers, money market mutual funds, high-quality municipal debt and variable rate demand loans, commercial and other mortgage-backed securities, corporate credit, corporate bonds, loans to small- and medium-sized businesses, business development companies, certain high yield securities, and some high-yield exchange traded funds.
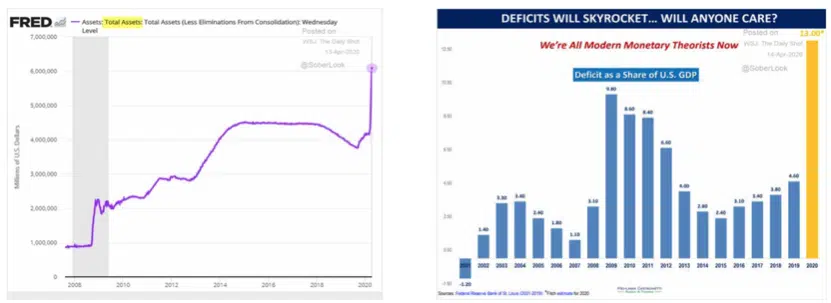
As a result of these actions, and the various Quantitative Easing programs instituted by the Federal Reserve during and in the wake of the 2008-2009 financial crisis, the left panel shows how the Federal Reserve’s total balance sheet has swollen, from $1.0 trillion in early 2008 to $6.0 trillion as of mid-April 2020. Numerous projections, taking into account the Fed’s money printing to purchase Treasury securities to help fund the enormous U.S. government deficits (estimated by the Federal Reserve Bank of St. Louis to reach 13% of GDP in 2020, as shown in the right panel above), posit that the Fed’s total balance sheet could reach at least $9 trillion. Such large and heretofore unencountered monetization of Treasury deficits naturally raises questions about: (i) America’s credit rating; and (ii) the long-term inflationary impact (with potentially upward pressure on interest rates) associated with massive money printing. While we share such concerns over the long term, we agree with Fitch Ratings, which on March 26, in affirming the U.S.’s AAA credit rating, stated that “recent dislocations and illiquidity in the market for U.S. Treasuries reflect changes in the structure of the market and exceptional conditions, and do not signal heightened perceptions of U.S. credit risk on the part of investors.” We are also of the opinion that, given the exceptionally large short-term contractionary and deflationary forces acting on the economy, the risks of rising interest rates are modest for now. As a consequence, income-oriented investors may purchase (or continue to hold) high-quality investment grade and municipal securities, as well as high yield issues at the uppermost end of the credit spectrum.
THE GOLD OUTLOOK
The precious yellow metal, gold (not subject to oxidation or corrosion, with 79 protons in its nucleus, and an atomic weight of 196.96) was termed “a barbarous relic” by the eminent British economist John Maynard Keynes (1883-1946). Gold has many fervent fans and equally passionate skeptics.
Paraphrasing from The Art of Asset Allocation, Second Edition, selected bullish and bearish views of gold are set forth below.
Bullish Views of Gold:
i. For centuries, the intrinsic value of gold has been widely accepted due to its rarity, beauty, durability, indestructibility, malleability, ductility, portability, divisibility, and anonymity;
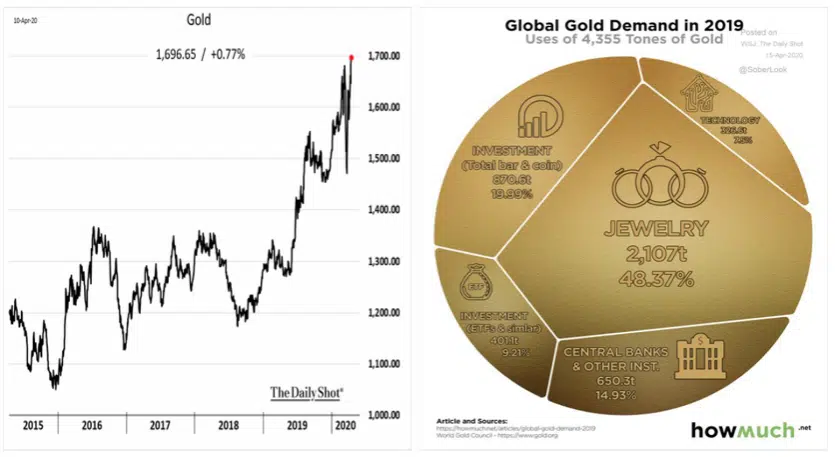
ii. Unlike many managed-paper currency systems’ “fiat money,” gold has a slowly changing and relatively inelastic supply, one reason why many central banks own and/or purchase gold (as shown in the right panel above, 15% of gold demand in 2019 came from central bank purchases), is to enhance perceptions that their country’s currency is at least partially anchored in a “real” asset. Gold is considered to be the only monetary asset that is not the liability of another party (as the renowned financier John Pierpont Morgan (1837-1913) is reputed to have stated, “gold is money; everything else is credit”);
iii. During many previous periods of excessive inflation, environmental catastrophe, financial markets turmoil, deflationary shock, monetary system failure, geopolitical instability, military action, or a breakdown in societal order and confidence, gold has been viewed as a form of insurance protection and refuge;
iv. Over sufficiently long periods of time, gold has tended to retain its purchasing power compared to the cost of fundamental human needs such as food, shelter, and clothing; and v. Gold has generally (though not always) exhibited negative or very low correlations of returns with almost all other asset classes, thus appealing to some investors as a form of hedging against unfavorable movements in financial asset prices.
BEARISH VIEWS OF GOLD:
i. Physical gold has no yield, trades in relatively low volume and at times in illiquid markets, is cumbersome to transport in large quantities, may incur costs of assay, custody, taxation, segregation, and insurance, and may be difficult to access in unsettled conditions;
ii. Partially owing to its reputation as a controversial, anti-establishment asset, gold may be subject to governmental confiscation through the sealing of safety deposit boxes and other measures, the declaration of gold payment classes as unenforceable, and governments’ arbitrary fixing of gold prices;
iii. For substantial intervals during eras of financial and geopolitical stability, gold prices may move essentially within a mean-reverting band, influenced by the level of real interest rates; the demand for jewelry, industrial uses and identified bar hoarding; and sources of supply, including new discoveries, production, forward sales and hedging by gold mining companies, gold scrap recycling, and central bank selling and gold lending activity;
iv. Although gold as an asset may be considered a conservative investment, some segments of the global physical and derivatives-based gold markets have at times been considered to lack sufficient regulation and have been thought to include speculative and momentum-based traders, promoters, conspiracy theorists, and dogmatic participants whose views may lack objectivity; and
v. Due to their effectively embedded option component linked to potential movements in gold prices, gold mining shares have substantially leveraged exposure to changes in the gold price, tend at times to be expensively valued, and may sometimes be difficult to assess using conventional methods.
As shown in the left panel, gold prices have been rising in recent years, driven by: limited levels of investment competition from declining, ultralow, and in a meaningful number of cases, negative interest rates; some degree of investor distrust in substantial money printing by many of the world’s major central banks; and “haven demand” by investors seeking protection from perceived systemic fragility and geopolitical instability.
Our view continues to be that gold and/or gold mining shares deserve consideration and a legitimate place in investment portfolios, with the specific percentage allocation determined by the investor’s motivations, fears, amounts to invest, objectives, and personal circumstances. The objective of gold ownership is not to achieve income generation, medical breakthroughs, technological advancement, or powerful brand positioning, which, after all, represent the primary function of investment in financial assets. Gold’s chief advantage in portfolios may be psychological as much as financial, stemming from its store of value characteristics and perceptions that it is the “currency of last resort.”
IMPORTANT DISCLAIMERS AND DISCLOSURES
Disclosures: Towerpoint Wealth is a Registered Investment Advisor. This platform is solely for informational purposes. Advisory services are only offered to clients or prospective clients where Towerpoint Wealth and its representatives are properly licensed or exempt from licensure. Past performance is no guarantee of future returns. Investing involves risk and possible loss of principal capital. No advice may be rendered by Towerpoint Wealth unless a client service agreement is in place. No portion of any content within this commentary is to be interpreted as a testimonial or endorsement of Towerpoint Wealth investment advisory services and it is not known whether any clients referenced herein approve of Towerpoint Wealth or its services; nor should it be assumed that any references to our clients are representative of all our clients’ experiences.