

MARCH 2020 MARKET COMMENTARY
Some Reflections and Possible Outcomes with the S&P 500 Down Seven Sessions in a Row
As this year‘s second month drew to a close on Friday, February 28, the S&P 500 index finished in correction territory at 2,954.22, down 12.8% over the seven consecutive loss-days from its February 19 record high of 3,386.15. All 11 of the S&P 500 industry sectors were showing year-to-date losses, and fully 95% of the S&P 500 companies were down 10% or more from their highs. Flows of capital were instead allocated into perceived safe–haven assets, driving U.S. Treasury two-year yields to 0.878% and 10-year U.S. Treasury yields to a new record low of 1.127%. Even as Federal Reserve Chair Jerome Powell inspired a Friday intraday rally when he indicated that the Fed is prepared to lower interest rates to protect the economy from the spreading economic slowdown, the Chicago Board Options Exchange VIX volatility index spiked to 40.11, its highest close since August 2015, which witnessed three devaluations of the Chinese yuan and a 43% two-month decline in the Shanghai Stock Exchange index. Gold finished at $1,564.10 per troy ounce (+2.9% year to date) and West Texas Intermediate crude oil closed at $44.76 per barrel (-23.1% year to date).
Although the rate of new COVID-19 infections in China has slowed, it should be apparent that a series of rather draconian restrictions (including quarantines, isolation, travel bans, lockdowns, contact tracings, and other strict measures) has been necessary to attempt this within the world’s second largest economy and most populous nation. Such measures have led to harmful consequences for Chinese — and thereby global, due to a much more intertwined worldwide economy than 10-15 years ago — manufacturing, logistics, and just-in-time inventory management (on the supply side) and travel, leisure, bricks-and-mortar commerce, and other forms of economic activity (on the demand-side).
In our opinion, the continuing flight-to-safety decline in bond and money market yields and the further selloff in equity prices is being driven by increasing concerns over the spread of the coronavirus within and between other countries in Asia, the Middle East, and Europe, coupled with emerging realizations that (i) an effective vaccine will take a longer time than generally anticipated to test, develop, and administer; and (ii) it is only a matter of time until the United States experiences outbreaks followed by deleterious effects on individual, corporate, and governmental behavior — producing hitherto unanticipated downward revisions to GDP growth and profit forecasts. For example, on February 27, Goldman Sachs predicted that earnings for S&P 500 companies would show zero growth this year, after earlier predicting that they would increase 5.5%. As of now, our call is for low to mid single-digit S&P 500 earnings growth in 2020, based upon some likely further policy stimulus and more of a V-shaped economic contraction and recovery.
It is important to keep in mind that our cautious and conservative stance (before this market correction in the S&P 500 and other equity indices commenced) has been based upon four main factors, among others:
- lofty price-earnings and price-to-sales valuation levels, many of which were in the 95 to 99th percentile relative to historical experience;
- heavy concentration of market leadership in a limited number of companies (with the top five stocks representing a record 19.0% of the S&P 500 aggregate market capitalization, even higher than the 18.5% previous all-time high, reached at the peak of the 1999 dotcom exuberance);
- the more than a decade-long age of the equities price advance and U.S. economic expansion; and
- a significant degree of complacency and nonchalance as evidenced in persistently bullish investor survey readings and low volatility metrics.
For now, we envision three possible scenarios going forward:
(Base Case, 50-60% probability in our opinion): The following factors: warmer weather; various preventive epidemiological and public health measures; some degree of measured monetary stimulus; and the experienced realization that — even with a possibly high infection rate and quite unpleasant side effects, the coronavirus mortality rate is quite low; leads to a short and meaningful decline in the economy in 2Q20, followed by a similarly rapid recovery, back to or slightly below earlier forecasted levels of economic growth. Cash levels can be slowly and judiciously deployed into diversified portfolios, continuing our emphasis on attractively-valued companies with solid earnings prospects and dividend protection.
(Optimistic Case, 20-25% probability in our opinion): The above scenario occurs but with large scale stimulus measures launched across a broad front to counteract increased worries over the potential negative economic and financial impacts of the spread of the coronavirus globally and in the United States potentially including:
- massive monetary, fiscal, and deregulatory stimulus by the Chinese Authorities;
- immense monetary stimulus by the Federal Reserve in the form of swift and larger-than-expected reductions in policy interest rates and a potential resumption of large-scale Quantitative Easing; and
- extensive fiscal stimulus in the form of across-the-board corporate and individual tax cuts and additional federal government spending
These actions are followed by sudden and sharp equity price recoveries, in which we would emphasize technology, consumer discretionary, industrial, materials, and energy companies.
(Unfavorable Case, 15-20% probability in our opinion): High levels of indebtedness, and lingering economic and psychological aftereffects of the coronavirus crisis, lead to a broad decline in hours worked, employment, wage growth, consumer confidence, and personal consumption, bringing on a recession in the second half of 2020, which is exacerbated by late and/or ineffectual policy responses and fears (unfounded, in our view) that it is a replay of the global financial crisis of 2008-2009. In such a scenario, emphasis should be placed on money market instruments, high-quality fixed income securities, and defensive equity industry sectors such as utilities and high-quality companies paying well-protected dividends.
Overall, we stand by our call over the past several months. We have been counseling and continue to counsel diligence, caution, and conservatism — with shorter duration, higher-grade exposure in the fixed income realm, emphasizing high-quality companies whose business results may have been affected by the coronavirus crisis, but whose intrinsic business models remain fundamentally sound, in defensive sectors with reasonable earnings multiples and well-covered dividend support.
As we did last month, we feature a select group of charts and associated commentary below.
Investment Lessons from a Master
On Saturday, February 22, 2020, Warren Edward Buffett released his annual letter to the shareholders of Berkshire Hathaway, and for the 55 years from 1965 through 2019, the compound annual growth rate in per-share market value of Berkshire was 20.3%, versus 10.0% for the Standard & Poor’s 500 with dividends included and reinvested. This means that an investment of $1,000.00 in the common shares of Berkshire Hathaway on January 1, 1965 was worth $25,978,226.78 on December 31, 2019, compared to $189,059.14 had that same $1,000.00 instead been invested in the S&P 500 with dividends included and reinvested — demonstrating: (i) the immense power of significant differences in compounding rates; and (ii) the massive effects of compounding over long time periods.
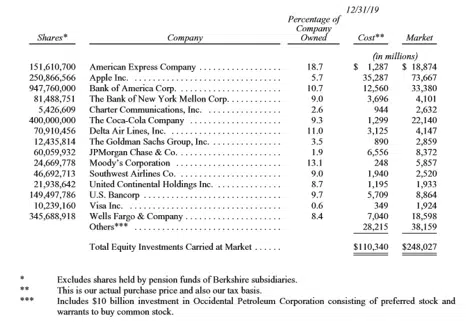
Page ten of the 2019 Berkshire Hathaway annual report also lists the 15 common stock investments of Berkshire that at yearend had the largest market value, shown above. It can be seen that over the 55-year lifetime of Berkshire Hathaway under Buffet’s stewardship, the total equity investment portfolio had as of yearend 2019 generated a pretax capital gain of $137.687 billion, of which just five stocks — American Express ($17.6B), Apple ($38.4B), Bank of America ($20.8B), Coca-Cola (also $20.8B), and Wells Fargo ($11.6B) accounted for $109.186 billion. This indicates that 79.3% of the total capital gain in Berkshire Hathaway’s equity investment portfolio over five-and-one-half decades came from five investment ideas, underscoring two of the important precepts espoused in “A Lesson on Elementary Worldly Wisdom,“ Warren Buffett’s partner Charlie Munger’s famous 1994 speech given at the University of Southern California Business School: “Stay within your circle of competence — figure out where you’ve got an edge, some of which you may have been born with, and some of which are slowly developed through disciplined effort.” And “Bet seldom and bet significantly, when markets offer you compelling opportunities.” Recognizing the wisdom of these two principles, for the majority of mainstream investors, we also emphasize investing in high-quality assets for the long-term rather than attempting to trade in-and-out on a short-term basis.
Energy Stocks Near Multi-Decade Lows
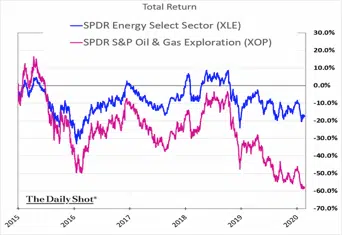
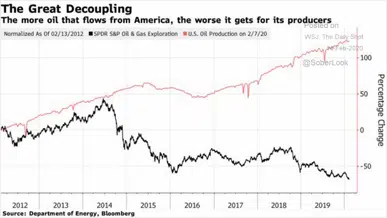
U.S. energy stocks have recently plummet to their lowest price relative to the Standard & Poor’s 500 in almost 80 years. This underperformance has taken place against the backdrop of:
- elevated coronavirus-related concerns over the 2020 trajectory of global growth (thereby putting downward pressure on demand for energy products);
- an oversupplied worldwide energy market, meaningfully augmented by the significant increases over the past 10 years of U.S. oil and gas output driven by hydraulic fracturing (a well stimulation technique, also known as “fracking,” in which oil- and gas-bearing rock is fractured by a pressurized liquid); and
- rising antipathy toward hydrocarbon-producing companies and/or divestments of some or all categories of fossil fuel assets by a number of institutional investors, including endowments, foundations, pension funds, and certain large sovereign wealth funds.
Noting the tendency for cyclical rebounds to gradually unfold following such extreme readings in energy stocks’ versus the S&P 500’s relative price performance, we think that value-oriented, somewhat contrarian-minded, mean reversion-aware investors may consider carefully building some exposure to this sector in a disciplined manner, focusing on companies with:
- capital discipline;
- meaningful plans to encompass renewable energy; and
- dividend maintenance strength.
Volatility Spikes
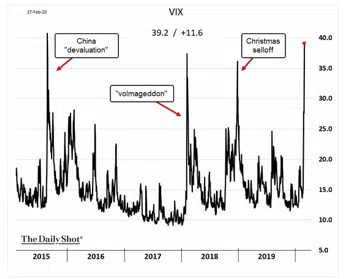
The “VIX” represents the ticker symbol and the popular name for the Chicago Board Options Exchange’s CBOE Volatility Index, a popular measure of the stock market’s (and financial markets’ more broadly) expectations of volatility as calculated based on S&P 500 index options. The VIX is computed and disseminated on a real-time basis by the CBOE, and is sometimes referred to as the “fear index” or “fear gauge.” Traders on the floor of various options and futures exchanges have for several years employed a shorthand expression regarding the VIX volatility measure: “When the VIX is low, it’s time to go slow, and when the VIX is high, it’s time to buy.” In other words, a low VIX reading usually indicates a fair degree of investor quiescence, complacency, and nonchalance, and sharply elevated readings generally reflect widespread concern — sometimes, even panicked selling — associated with equity market washouts that may signal a cyclical bottoming in asset prices. Mindful of the continuing degree of uncertainty relating to the impact of the coronavirus on the global economy, our recommendation is that investors should remain aware of the VIX level as a general barometer (rather than a precise thermometer) of financial market sentiment, viewing a series of too-low readings with ongoing skepticism and by contrast, considering significantly high readings as potential signposts for adding funds to the equity markets.
Equity Valuations Still Above Average
The fundamental drivers of all asset prices — including stocks; bonds; real estate; agricultural, industrial, and other commodities; precious metals; and even such asset categories as jewelry, art, and collectibles — are driven by various combinations of:
- fundamental forces (such as earnings, economic trends, and dividend, interest, and rental payments);
- valuation measures (relating prices to revenues, earnings, book values, and other measures); and
- psychological, sentiment, and technical factors (such as surveys of bullish and bearish views, initial public offering and merger and acquisition volume, aggregate trading activity, charts of price trends, new highs compared to new lows in prices, advance-decline lines, and moving-average computations).
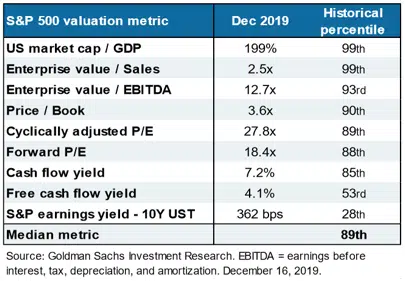
While fundamental factors tend to be the preeminent forces on asset prices during extended upward or downward moves, and psychological, sentiment, and technical factors tend to exert a dominant influence at major turning points (with extreme euphoria and optimism characterizing market tops, and extreme despondency and despair characterizing market bottoms), valuation metrics are used as a reality check and to provide useful and much needed historical perspective on asset pricing. Prior to the recent coronavirus-driven changes in equity, fixed income, precious metals, energy, and currency prices, it can be seen from the above table that many valuation measures of the Standard & Poor’s 500 composite index as of yearend 2019 were registering in the 88th to 99th percentile of their historical valuation readings. Such elevated valuation measures — including U.S. Market Cap/GDP; Enterprise Value/Sales; Enterprise Value/EBITDA (Earnings Before Interest, Taxes, Depreciation, and Amortization); Price/Book Value; Cyclically Adjusted P/E; and Forward P/E — have been an important influence on our multi-month message of caution and conservative portfolio positioning. Even though the S&P Earnings Yield (the inverse of the Price/Earnings ratio) minus the 10 year U.S. Treasury yield was only at the 28th percentile (due to ultra-low interest rates), in our view, the recent pullback in most of these valuations still leaves them at well-above-average historical levels and underscores our continued counsel of vigilant, careful, and cautious investment strategy and asset allocation.
Equity Performance in Presidential Election Years
Widespread wisdom concerning U.S. equity market performance in the four years of a presidential term — promulgated among other market prognosticators, by Yale Hirsch in The Stock Trader’s Almanac, with his “Presidential Election Cycle Theory“ — usually holds that:
- the best year is year three; followed by
- year four, as various forms of economic stimulus may be applied in advance of the election itself;
- year one, characterized by the good feelings after a national election; and lastly,
- year two, when the effects are felt of whatever economic and policy “housecleaning” has been effectuated.
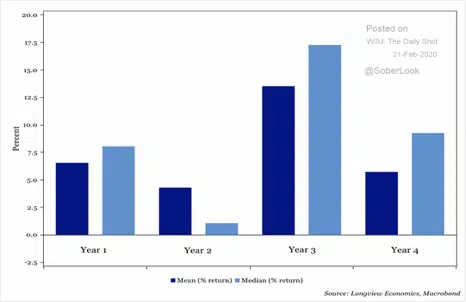
For the 23 presidential election cycles since 1928, the upper panel shows the mean (which is the conventional arithmetic average) and the median (defined as the midpoint) of the S&P 500 average returns in each year of a presidential term. We caution that these outcomes reflect average performance, and a given presidential cycle can deviate, sometimes meaningfully, from the results generated over the past 92 years. This can be seen in the lower panel, which shows the Standard & Poor’s 500 performance for the 42nd, 43rd, 44th, and 45th U.S. presidencies. For example, in year four of President Bush’s second term, the S&P 500 substantially lagged the performance of the other three years, and in both of President Obama’s terms, the first two years produced the best performance. As calendar year 2020 progresses toward Election Day on Tuesday, November 3, we advise to be aware of the psychological and sentiment impact that is likely to be felt on quite a number of industry groups during the upcoming presidential campaign. With corporate taxation, industry dominance, and market power likely subjects of discussion and debate, sectors expected to be in the spotlight include, among others oil, gas, coal, and hydraulic fracturing; pharmaceuticals, biotechnology, and medical devices; and social media and other technology-enabled companies. Investors would be wise to give careful consideration to the intermediate- and longer-term implications of this year’s elections for specific holdings in these and other industries.
Tax Proposals of Presidential Candidates
Regardless of one’s political persuasion and tax bracket, we think it is quite important from an investment standpoint to pay close attention to the likely post-election contours of the top marginal tax rates on labor and investment income. Investor psychology, consumer behavior, and corporate profitability are influenced to a significant degree by the trend and level in federal (as well as state and local) taxes on labor income. In addition, taxes on capital (investment income) affect investment, a major determinative factor influencing productivity growth, and thus, wage growth.
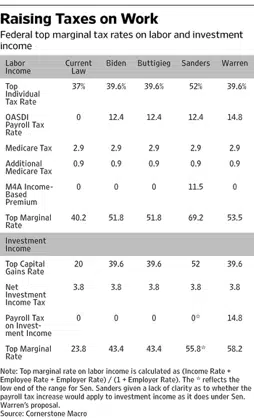
Quite apart from the media and debate attention given to several Democratic presidential candidates’ proposed single-payer health care and wealth taxes, the table to the left sets forth the current federal top marginal tax rates on labor and investment income under current law and also shows the size of the much-less-publicized tax increases on labor and investment income proposed by three of the Democratic presidential candidates. The top marginal federal tax rate on labor is currently 40.2%, (including the 2.9% Medicare tax) with the proposed top marginal tax rate proposed by the three (Buttigieg suspended campaign 3/1/20) cited presidential candidates ranging from 51.8% to 69.2%. The table also shows that the top marginal tax rate on investment income is 23.8%, with the proposed top marginal tax rate proposed by the three cited presidential candidates ranging from 43.4% to 58.2%. Our counsel is to pay particular attention to these and other candidates’ tax proposals, focusing on their impact on corporate, consumer, and investor behavior.
For additional perspective on the evolution and complexity of the U.S. federal tax code, we share the following thoughts:
Approaching the annual April 15 due date for tax filing, we also offer the following reflections relating to the history of federal income taxation and the size of the federal tax code. The United States tax system has evolved through the nation’s history, from an initial revenue-generation reliance on tariffs, with new income taxes and other levies generally introduced during times of war to raise additional revenue, then being allowed to expire once the war was over. In the years after 1900, popular and legislative support began to build for a continual income tax, and in February 1913 the Sixteenth Amendment was ratified to the Constitution, granting Congress the power to collect taxes on personal income.
According to Thomson Reuters-Refinitiv and Wolters Kluwer CCH (the latter of which has analyzed the federal tax code since 1913), in the first 26 years of the federal income tax, the code only grew from 400 to 504 pages, and even during President Franklin Delano Roosevelt’s New Deal, the tax code came in comfortably under 1,000 pages. Changes implemented during World War II increased the total code (including appendices) to 8,200 pages; by 1984, it had swollen to 26,300 pages, and as of early 2018, several Congressional and media commentators have pointed out that the federal tax code exceeds 80,000 pages. The length of the actual current actual tax code itself runs in the neighborhood of 3,000 pages, with over 75,000 additional pages devoted to the inclusion of: all past tax statutes; Internal Revenue Service regulations and revenue rulings; and annotated case law covering court proceedings surrounding the tax code.
Warm Regards,
Joseph F. Eschleman, CIMA®
President
Towerpoint Wealth, LLC
Disclosures: Towerpoint Wealth is a Registered Investment Advisor. This platform is solely for informational purposes. Advisory services are only offered to clients or prospective clients where Towerpoint Wealth and its representatives are properly licensed or exempt from licensure. Past performance is no guarantee of future returns. Investing involves risk and possible loss of principal capital. No advice may be rendered by Towerpoint Wealth unless a client service agreement is in place. No portion of any content within this commentary is to be interpreted as a testimonial or endorsement of Towerpoint Wealth investment advisory services and it is not known whether any clients referenced herein approve of Towerpoint Wealth or its services; nor should it be assumed that any references to our clients are representative of all our clients’ experiences.